In our previous blogs—Five reasons to move to Modern Data Analytics and Moving through the Data Maturity Model—we discussed the big questions of why organisations need to move to modern data analytics and what it looks like to move through the data maturity model.
In this blog, we are moving to the question of how, focussing upon an organisations progress through their "Data Journey". This framework outlines the steps of how an organisation's data moves from source to insight. The content is non-technical, giving end users and key decisions makers a broad overview of what we call the Data Analytics Architecture. The simplified framework discussed is largely unchanged over the past few decades.
Five Steps in Data Analytics Architure
In its broadest sense, an organisation's data journey can be visualised as a funnel. Organisations generally have multiple operational and financial systems which are the source of data. By itself, this large raw data lacks significant value, and moves through several refining steps allowing it to be consumed in a smaller data set.
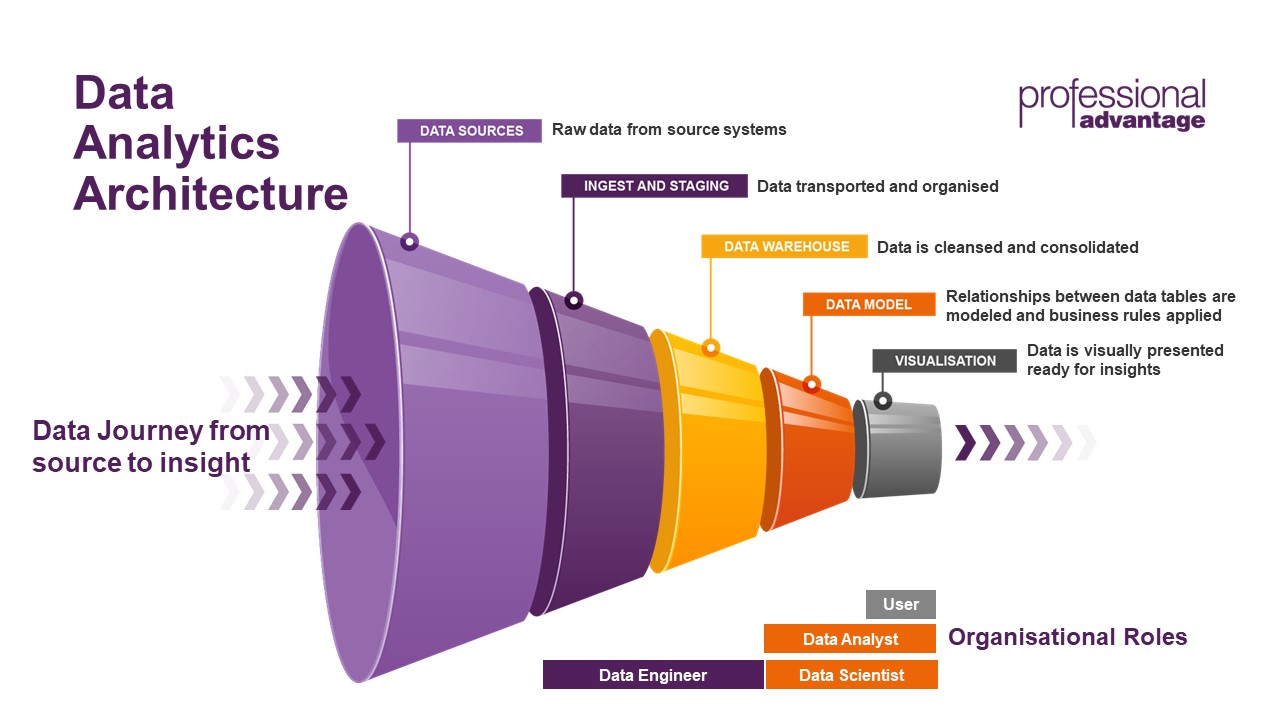
The five steps are as follows:
- Data Sources: This is the raw data from source systems. It may be transactional from finance and operational systems, or simply Excel files. This data can reside both locally and in the cloud.
- Ingest and Staging: This stage involves extracting the data from the source systems and moving to a central location for further organisation and storage.
- Data Warehouse: The data is transformed, consolidated, and cleansed. It is then stored ready for the next stage.
- Data Model: In this stage we create the relationships between the data, add business rules, and create the aggregations required for analysis.
- Visualisation: We create the visuals and publish the analytics solution for end users.
Data Journey for Foodies
A better way to understand the five steps in the Data Analytics Architecture is using a food analogy. Imagine that you are sitting down at your favourite restaurant for a meal. You only experience the final presentation of the food: the atmosphere, presentation, taste, and texture. However, the food has undergone multiple stages of preparation.
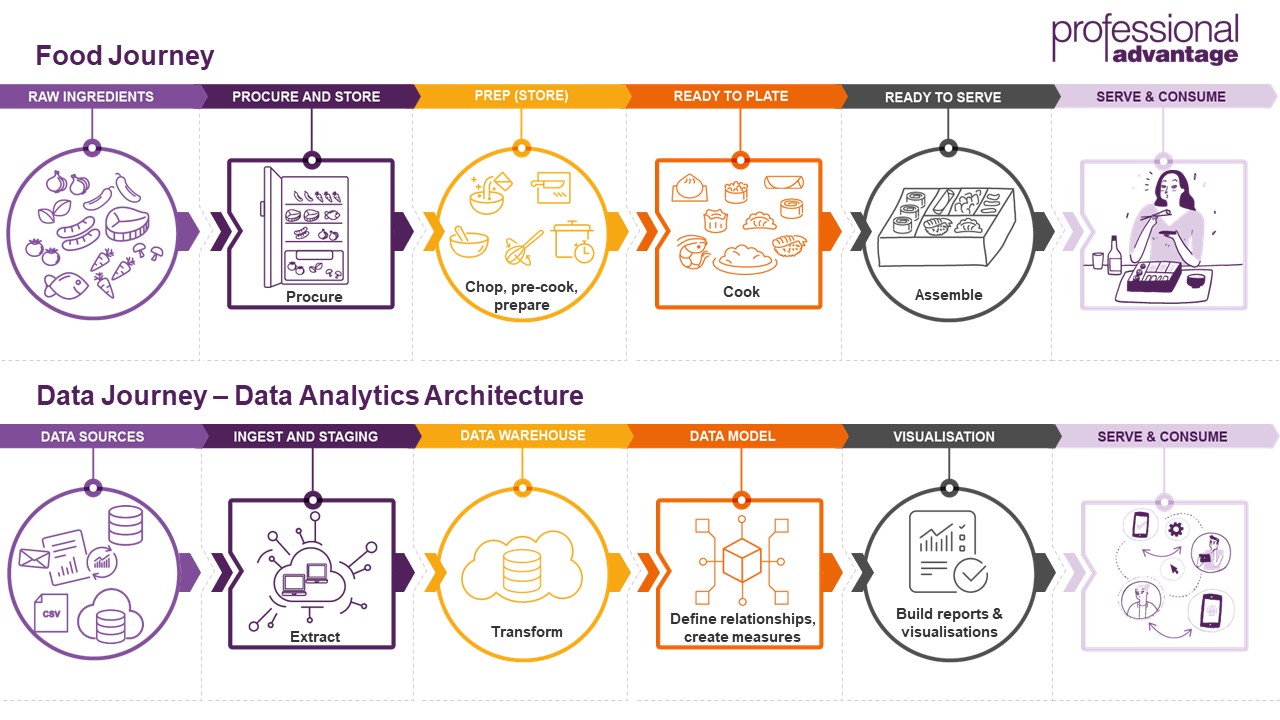
- Raw Ingredients: Just as the raw ingredients are grown and harvested, our organisational data sources produce data.
- Procure and Store: Our ingredients are transported to the restaurant and stored, just like our data is ingested and staged.
- Preparation: Our raw ingredients will be cleaned, chopped, and prepared for cooking, similar to data warehouse step.
- Ready to Plate: The ingredients are combined and cooked together, in the same way the data is combined in the data model step.
- Ready to Serve: The food is then plated and presented for consumption which represents the visualisation step in our data journey. Just like our food, the data is then served and consumed.
Just as food goes on a journey from farm to table, an organisation's data goes on a similar process from its raw state to curated insights.
We hope this blog has given you a better understanding of the Data Analytics Architecture and the key steps in this journey.