Standalone Copilot in Power BI introduces a new way to explore data across your organisation's data estate. It’s a full-screen, cross-workspace experience that lets you search, analyse, and create insights across multiple data sources in Power BI and Microsoft Fabric. While Copilot in Power BI focuses solely on the report you’re currently viewing, Standalone Copilot enables you to find greater insights from your wider Fabric environment.
If Copilot in Power BI answers “What does this report tell me?”, then Standalone Copilot answers “What does all my data across Fabric tell me?”
In a recent blog, we discussed “What can I do with Copilot in Power BI?”. The blog explained how Copilot in Power BI helps users summarise data within a report, create visuals, explore semantic models, and generate DAX queries using natural language.
We also discussed Fabric Data Agents in another blog post: What are the new Fabric Data Agents?, how they translate natural-language questions into SQL, DAX, or KQL, and return answers based on the data sources you configure.
Standalone Copilot bridges the gap between the report-level Copilot and Fabric Data Agents. It can analyse multiple Power BI models and multiple Fabric data sources through a Data Agent, but remains a guided in-product experience within the Power BI or Fabric homepage. Alternatively, Fabric Data Agents can be extended to enable access from other applications outside of Fabric, such as Teams or Microsoft 365 Copilot.
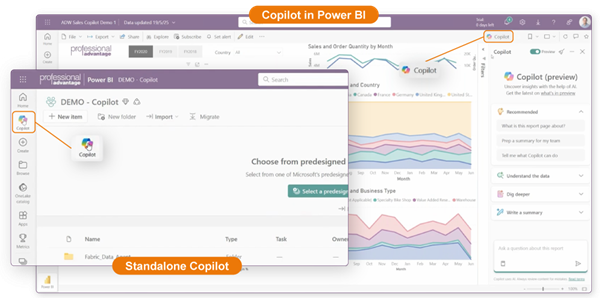
Where do you access the Standalone Copilot?
You access Standalone Copilot from the Copilot button in the main Power BI navigation pane, instead of directly inside a report. That difference matters because the experience is no longer tied to a single model, report, or page.
Once opened, Standalone Copilot becomes a full-screen conversational interface designed specifically for searching and analysing your organisational data.
What Standalone Copilot Can Do
1. Search Across Multiple Data Sources
Standalone Copilot can identify reports, semantic models and Data Agents relevant to your question. For example, searching for “product sales” surfaces every Fabric item that relates to sales, not just the report you happened to be viewing.

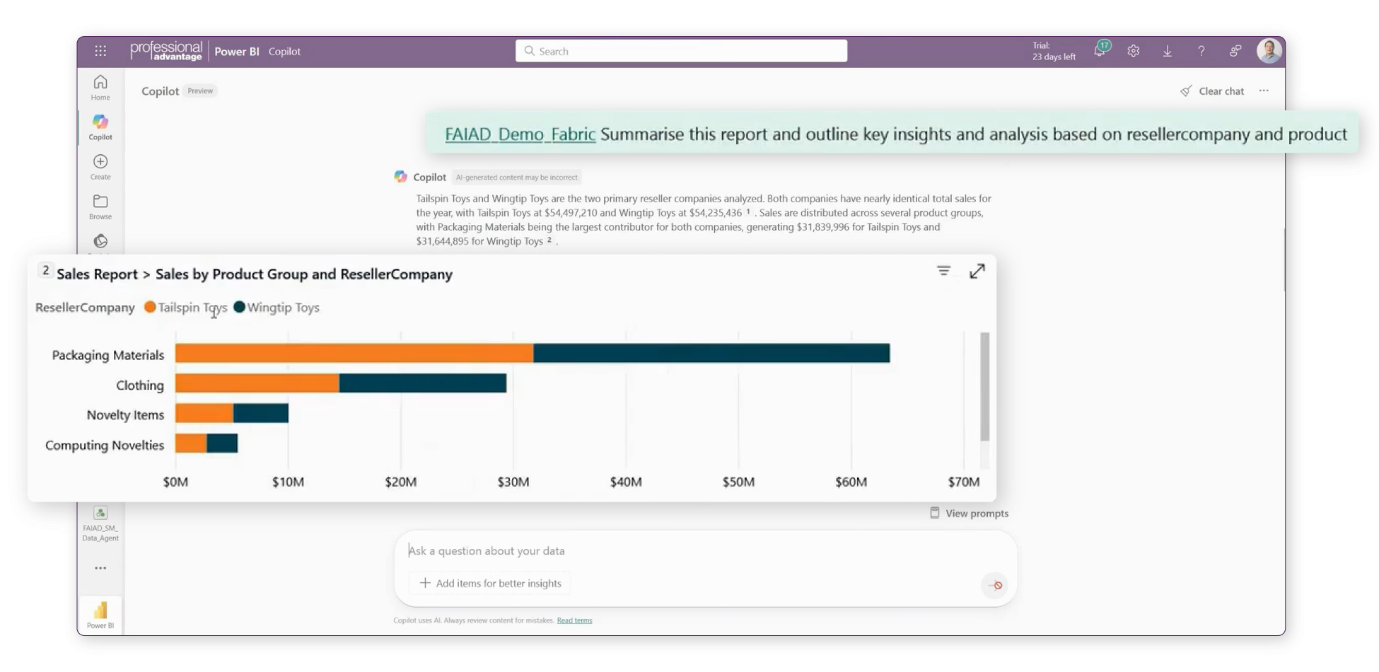
2. Summarise Reports and Data
Ask it to outline or summarise a selected report, and it produces a narrative description of key visuals, trends and fields, helping users quickly understand data and gain insights.

3. Pull Verified Visuals
If your reports have “verified answers” configured, Copilot can show the exact visual you want it to use when responding to certain questions. For example:
“What are my sales over time by reseller company?”
Standalone Copilot can surface a pre-approved visual straight from the report.
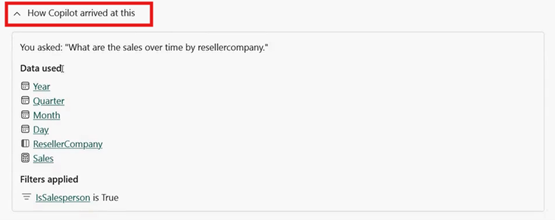
4. Explain Its Logic
Every answer includes "How Copilot arrived at this", which reveals the exact columns, measures, and filters used. This helps analysts validate the logic, which is crucial for trust and transparency.
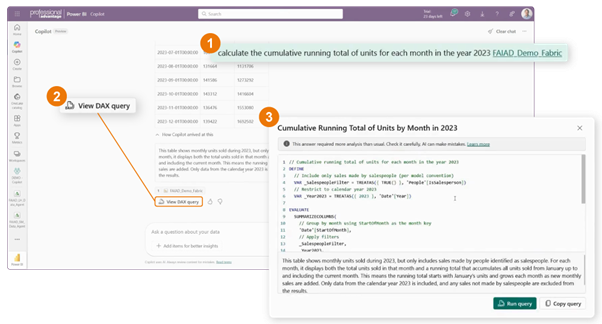
5. Generate and run DAX queries
One of the most powerful features of Standalone Copilot is that it can write DAX queries, run them against the semantic model, and, in some cases, even allow you to add them back into the model. Ideal for analysts who need calculated measures quickly without having to start from scratch.
6. Explore and Modify Visuals
Once Copilot generates insights, users can explore the visuals, modify fields (e.g., switching a breakdown from product group to country of manufacture), and open the result in a new tab for further use.
The Real Value: Faster, Broader Insight
Standalone Copilot is designed for speed-to-insight.
Instead of navigating through multiple workspaces, opening reports, checking models, and dragging fields into visuals, users can simply ask a question, and Copilot finds the right data asset, retrieves the insight, and explains the logic behind it.
This enables:
- Business users to query and understand data using natural language.
- Analysts to explore and generate DAX queries faster.
- Business leaders with quicker access to the data that matters.
All without requiring users to know where the data lives or how it’s structured.
Some limitations to be aware of
*Note: At the time of writing this blog, Standalone Copilot is in preview and features may change.
- Queries are session-based, and your history isn’t saved.
- Answers must be validated. Copilot warns users to check its work.
- Fabric capacity consumption increases when testing or using Copilot frequently.
- Data prep takes time. Tuning models and reports for use with Copilot is essential, not optional.
When to Use Standalone Copilot
Use Standalone Copilot when you want to:
- Explore data across multiple reports, models or agents.
- Summarise a report quickly.
- Generate or validate DAX queries.
- Compare multiple data sources.
- Ask broad questions that span your workspace.
- Get faster direction to the right dataset.
It shines when users need broader context, cross-workspace insight, and faster analysis, all without needing to know where the data lives.
Learn more about Standalone Copilot in Power BI
Watch the full demo from our recent webinar Work Smarter with Data: Standalone Copilot in Power BI and Fabric Data Agents.