
In many parts of Europe, the concept of Management Accounting does not exist in organisations. Instead a role exists for a “Business Controller”. One of the main accountabilities of a Business Controller is to act as a Business Navigator.
The metaphor of a maritime navigator complements the task ofvariance analysis for decision making and forecasting. That is, a purpose ofvariance analysis is to understand the effectiveness of a measured not-for-ptofitactivity in relation to planned actions.
Ideally the measures of business activities (Key Performance Indicators) have a direct link to achieving the mission objectives. The progress that an organisation makes towards the planned strategic objectives is measured as variances. The variances highlight the success or otherwise of the programmes, grants, and use of funds, and identify decision points that are required. The decision may involve changes in process, allocation of funds, grant management, and the assignment of staff and volunteers.
The quality of navigational decisions is dependent upon the navigationaltools employed. Today the Power BI business intelligence visualisationsoftware is the organisations navigation tool.
Just like a maritime navigator, the effectiveness of theinformation a navigator provides to the captain will influence the quality ofdecisions made. The quality of decision making will then influence howefficiently the ship (organisation) fulfils its mission. The critical organisationaldecisions can have a major influence on workforce and volunteer utilisation,and ultimately the results of the grant funded mission.
A Management Reporting professional plays much the same rolein not-for-profit organisations. The use of business intelligence tools; thepresentations of data in respect to predetermined KPIs; the understanding ofindustry and business circumstances; and ultimately the recommended actions areall aspects of the management reporting role including enhancing transparencyand compliance.
Let us consider frameworks, analytical tools, and practices in respect of conducting variance analysis and forecasting.
Variance Analysis Framework
The fundamental purpose of variance analysis is to detect and assess organisational performance. Variance analysis provides clarity on the success or otherwise of grant and funding objectives and initiatives that directly cascade from predetermined measures of success. From the detection of variance, actions and remedies are assigned to assist with workforce and volunteer utilisation that enhances the value creation process for not-for-profit organisations. The value creation process is considered by Robert Kaplan and David Norton (the authors of The Balanced Scorecard and The Strategy-Focused Organization [sic]) to be at the centre of delivering business strategies. Whether an organisation is a commercial business, listed company, government department, or not-for-profit, the analysis of measures and the actions that flow from the analysis is central to the value creation process and the experience of the customers, clients, or general public to achieve their full potential.
Variance analysis has traditionally been used as a management control tool. From the aspect of management control, Robert N. Anthony, Emeritus Professor of Harvard University, outlines in his works on management control systems a framework for organising and the variance analysis process.
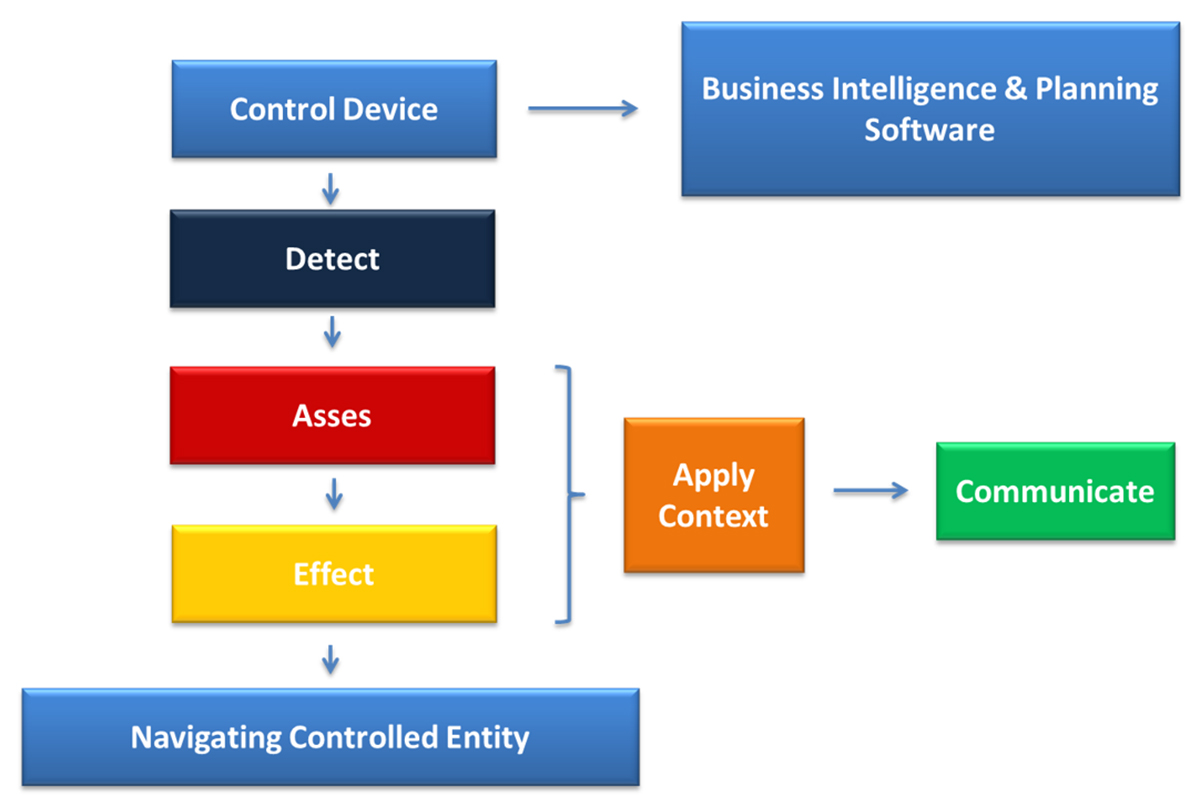
The framework for variance analysis begins with theeffective use of the Control Device. The control device in the case ofmanagement reporting will be the business intelligence software thatinterrogates and presents reporting data. The architecture of the controldevice and how it complements business process will determine the accuracy,reliability, and timeliness of data. The control device acts as the underlyinginfrastructure from which the variances are detected.
Once the KPIs have detected raw information regarding whatis happening in the organisation, the information is then assessed.
The assessment of KPI information is matched againstexpected standards, planned outcomes for a level of activity, or input. Theenvironmental context is also considered. The environmental considerations mayinclude changes in competitive environment (new entrants, or product/servicesubstitutes), changes in input prices, supply chain patterns, resourcecapacity, government legislation, or loss of major clients or customers.
The final stage in Robert N. Anthony’s framework is theeffect. The effect is the “behaviour alteration, if needed”, as mentionedwithin his book Management ControlSystems: Ninth Edition. The effect focuses on what actions are required totake place to make the necessary adjustments to resource allocation, process,or workflow to facilitate the desired organisational outcomes. Using thesailing metaphor, what are the changes in direction required to reach the statedstrategic destination of the business?
In the practical application of Anthony’s framework, thecommunication links between detection, assessment, and desired effect uponorganisational outcomes is critical. The communication of information to theright people at the right level, with the appropriate decision-making authority,needs to be delivered in the right context to enable the appropriate organisationalactions to take place in a timely manner.
Anthony’s framework focuses on navigating the controlledentity to its desired strategic destination. Underpinning Anthony’s frameworkis the foundation of having the appropriate control devices that will provideinformation of strategically aligned KPIs.
You can leverage variance analysis to ensure your fundsachieve the full potential in the delivery of grant operations and make adifference to the community, whilst at the same time increasing transparency andcompliance.
Are you using your business intelligence tools to position your decision makers to make the best decisions?
Are you ready to improve your not-for-profit reporting process?
Watch the webinar now!
Join Business Intelligence consultants Chris Catto and Greg Long in this on-demand webinar to find out how Microsoft Power BI can help not-for-profit organisations improve their reporting outcomes in the areas of:
Grants and funding management, procurement and spend analysis, and real-time reporting and data insights.